Examination Questions in Data Interpretation - 7
Click on the option you think is right and then check by clicking on the Show Answer button. You can change your option as many times as you like.
Study the chart carefully and answer the questions.
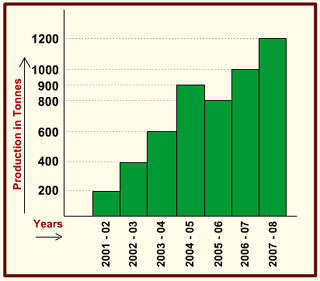
1. The production in 2006–07 in comparison to the production in 2002–03 increased by
- 110%
- 120%
- 125%
- 150%
2. The production decreased from 2004-05 to 2005–06 by
- 9 1/ 9%
- 10 1/ 9%
- 11 1/ 9%
- 8 1/ 9%
3. The year in which production increased the lowest as compared to the previous year is
- 2007 - 08
- 2006 - 07
- 2004 - 05
- 2003 - 04
4. The production from 2003–04 to 2007–08 increased by
- 75%
- 100%
- 125%
- 50%
5. The production figure for the year 2004–05 was exaggerated by 200 tonnes. What is average production for the years from 2001-02 to 2007–08 with the corrected figures?
- 550 tonnes
- 600 tonnes
- 650 tonnes
- 700 tonnes