Examination Questions in Data Interpretation - 3
Click on the option you think is right and then check by clicking on the Show Answer button. You can change your option as many times as you like.
The given histogram shows the average pocket money received by 60 students for a span of one month. Study the diagram and answer the questions given below.
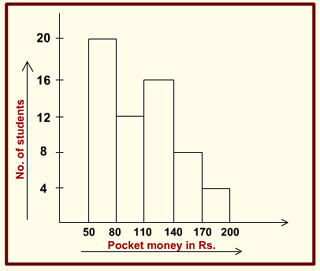
1. Maximum number of students received pocket money between
- 50 - 80
- 140 - 170
- 80 - 110
- 110 - 140
2. The number of students who received pocket money up to Rs. 140 is
- 20
- 32
- 48
- 56
3. The number of students who received pocket money above Rs. 80 and upto Rs. 170 is
- 30
- 36
- 28
- 40
4. What percentage of students receive pocket money between Rs. 140 and Rs. 170 when compared to those receiving between Rs. 50 and Rs. 80?
- 50
- 36
- 44
- 40
5. If students receiving pocket money above Rs. 110 are from rich families and others from poor families, then what is the ratio of rich students to poor students?
- 7 : 8
- 5 : 6
- 14 : 15
- 8 : 7