Examination Questions in Data Interpretation - 4
Click on the option you think is right and then check by clicking on the Show Answer button. You can change your option as many times as you like.
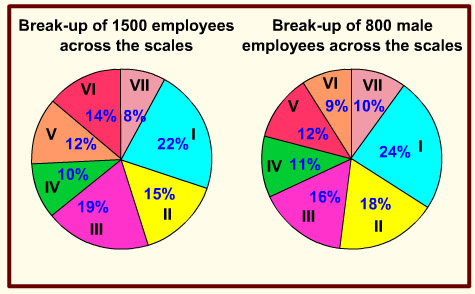
The following pie-chart shows the details of 1500 employees working in a company in various scales and also the break-up of 800 male employees across the scales. Study the pie-charts carefully and answer the questions.
1. How many females are working in scale V?
- 180
- 144
- 96
- 84
2. The male-female ratio working in scale VII is
- 1 : 2
- 2 : 1
- 2 : 3
- 3 : 2
3. The scales in which the number of working females is the same are
- I and VI
- I and III
- III and VI
- only III
4. The number of scales in which the female workforce is less than the average female workforce is
- 5
- 2
- 3
- None of these
5. Had the total number of employees working in the company been 1600 (800 male, 800 female) and pie charts of break-up across the scales the same, the percentage increase or decrease of female workforce in scale VII is
- 10% decrease
- 15% increase
- 20% decrease
- 20% increase