Examination Questions in Data Interpretation
Click on the option you think is right and then check by clicking on the Show Answer button. You can change your option as many times as you like.
The bar Graph given here shows the population (in crores) of India in various census years. Observe the graph and answer the question based on it.
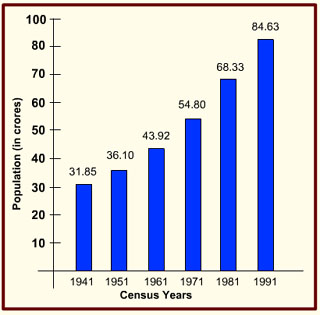
1. The per cent increase in population from 1971 to 1991 is
- 54.8
- 50
- 54.4
- 53.5
2. In which census year, the per cent increase in population is highest as compared to that in the previous census year ?
- 1951
- 1971
- 1961
- 1981
3. In which census year, the per cent increase in population is least as compared to that in the previous census year ?
- 1961
- 1951
- 1971
- 1991
4. Per year increase in population from the year 1941 to 1991 is
- 10565000
- 10665000
- 10556000
- 10456000