Examination Questions in Data Interpretation - 8
Click on the option you think is right and then check by clicking on the Show Answer button. You can change your option as many times as you like.
The following bar diagram shows the percentage of three communities - Community A, Community B and Community C in a state during the years from 2004 to 2007. Examine the bar diagram and answer the questions.
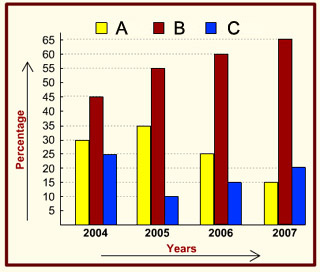
1. The ratio between the populations of Community A and Community B in 2004 was
- 2 : 3
- 3 : 4
- 3 : 5
- 1 : 2
2. If the total population of the state in 2004 was 5 lakhs, then the combined population of Community A and Community C in that year was
- 250000
- 225000
- 200000
- 275000
3. If the total population of the state in 2005 was 5 million, then the population of Community A was [ 1 million = 10,00,000]
- 1500000
- 1750000
- 2000000
- 1250000
4. If the total population in 2004 was 4,00,000 and in 2006 it was 6,00,000, by how much has the population of Community B increased in 2 years?
- increased by 25%
- increased by 50%
- increased by 100%
- remained the same
5. If the total population has doubled in 2007 when compared to 2004, what has been the effect on the population of Community A?
- remained the same
- increased by 50%
- decreased by 50%
- decreased by 15%